Emissions Trading
Putting a Price on Carbon
Climate change and carbon emissions are a good example of what is known as a market failure since the market is not functioning to maximise the welfare of society as it does not factor in the damage caused by carbon emissions. Carbon emissions, like other polluting activities, are referred to as an externality since the true cost of emitting carbon dioxide is not factored into the cost of production by the emitting companies. Instead, the cost is external to the company, since the cost and impact of the CO2 emissions are borne globally and not only by the polluting entity. A localised example would be a factory situated on a river that pollutes the water, causing health problems for people living downstream.
It is generally accepted that the best way to correct a market failure is to place a price on the externality that reflects it's true cost. In the case of climate change, this requires putting a price on a tonne of carbon that reflects the net cost to society. For example, the amount of CO2 emitted from activities include:
Putting a Price on Carbon
-
A single passenger’s emissions on a flight from London to New York: 2 tonnes of CO2.
-
The heating/electricity for the average home in Europe for one year: 5-7 tonnes of CO2.
-
The average middle-aged adult in Europe has a total annual carbon footprint of 10-20 tonnes.
Tax or Cap and Trade
There are two ways to implement a price on carbon emissions which either provide certainty on the value of the externality or the amount that is produced; a tax or a cap and trade system. Both of these policies can achieve the goal of pricing carbon, providing a strong financial incentive to reduce emissions, and both policies have been implemented around the world, sometimes together.
Emissions trading schemes (ETS) have been established in multiple countries around the world as a market-based solution for reducing carbon emissions. An ETS is a form of cap and trade since the program caps the total amount of emissions while allowing the emitting entities to trade emission allowances between them. This market-based approach has proven to be very successful at reducing emissions at the lowest cost. The cap on total emissions is reduced each year to provide environmental certainty of achieving emission reduction goals while allowing the market to set the price of CO2 that can be traded between participants. Conversely, a tax ensures the the price of carbon is certain whilst allowing the quantity emitted to fluctuate.
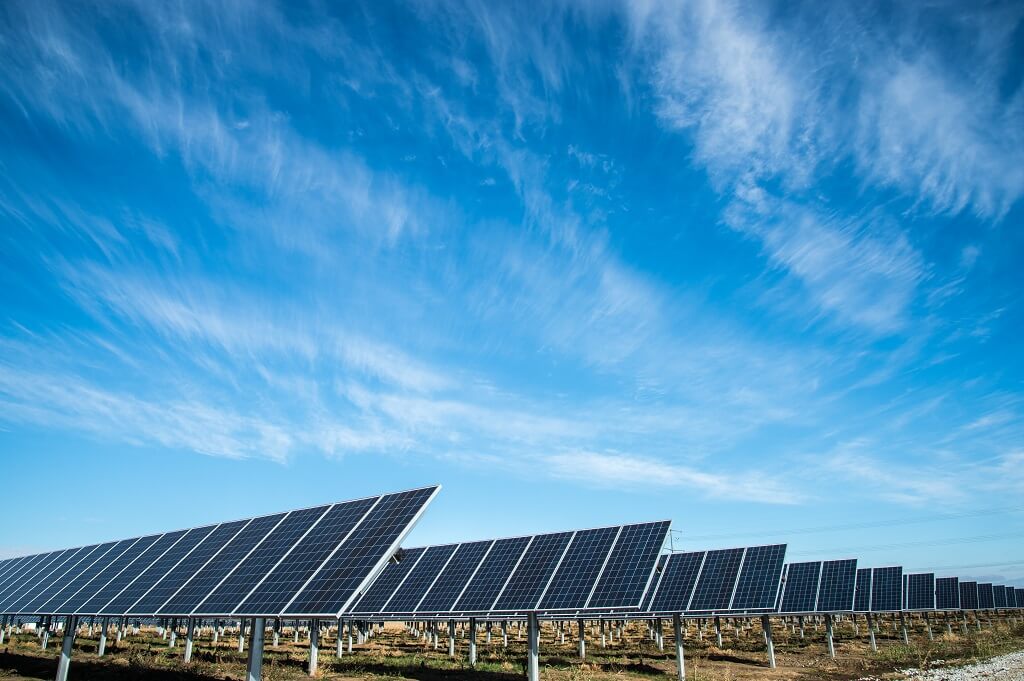
Emissions trading is spreading globally with 8 systems currently in force and a further 4 scheduled for implementation and 9 being considered
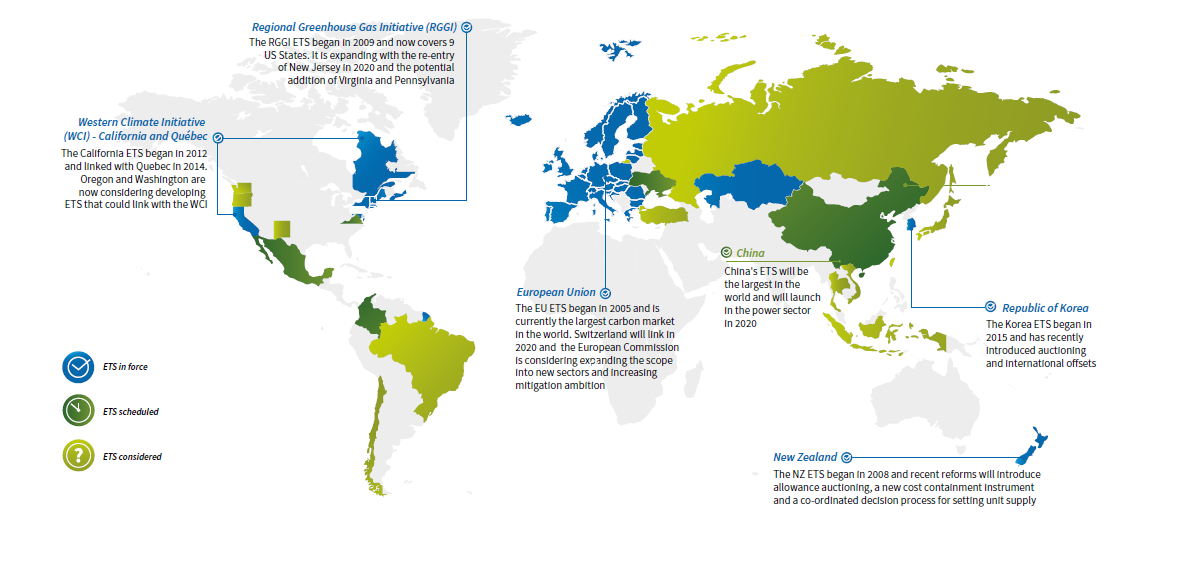
Typically, emitting companies must purchase (or be allocated) carbon allowances, with each allowance normally allowing the holder the right to emit 1 tonne of CO2 emissions, and these rights able to be traded freely. There are a number of emissions trading systems around the world and multiple additional countries are preparing to launch their own schemes. The EU ETS was the world’s first and is by far the largest system, covering 11,000 emitting entities in 31 countries and 1.8 billion tonnes of annual CO2 emissions. China is planning to launch its own national ETS in 2019 and this would then be the largest in the world. The International Carbon Action Partnership (2018) provides a summary of current and planned schemes around the world.
How a Cap and Trade Emission Trading System Works
To illustrate how an ETS results in physical emissions reductions (abatement), a generic example follows. If an electric utility is regulated under an ETS, it will need to demonstrate compliance with the rules of the system at the end of each compliance period, typically annually. The company will be required to deliver carbon allowances to the regulator equal to the amount of CO2 tonnes emitted; whether this means the company has to purchase allowances or not is irrelevant to the regulator. Failure to comply incurs costly penalties with the current EU penalty, for example, set at €100/tCO2.
If the utility needs to add more electricity capacity, they will have to decide between using fossil fuel-based electricity generation or renewable energy technology, such as wind or solar power generation. Since the fossil fuel-based solution will generate CO2 emissions, the company will need to factor the cost of carbon allowances into its decision. This creates a financial incentive that favours low carbon solutions like wind and solar.
If the company were to replace fossil fuel-based electricity production with renewable electricity production, this would result in lower emissions, leaving the company with unused allowances at the end of the compliance period. These unused allowances could be sold into the market or held and used in next year’s compliance period. Again, the decision to switch from fossil fuel generation, which emits carbon dioxide to a clean energy solution, has a direct financial incentive to opt for the clean energy solution. On the other hand, if the company wants to emit more CO2 via fossil fuel technology, then it will need to purchase additional allowances in the market and it will incur extra cost.
The combination of dynamic supply and demand drivers combined with the annual reduction in the supply of carbon allowances, informs the market pricing mechanism which sets the price for a tonne of carbon dioxide emissions. Basic economics means that as the price of carbon increases, it provides a larger financial incentive for emitting entities to find ways to reduce their carbon emissions. The reduction of emissions is commonly referred to as “Abatement” and each company will have a range of actions they can take to abate emissions, from low-cost activities to higher cost activities. Companies will normally choose the low-cost activities first and then move up to higher cost activities until they hit the point at which it is not financially attractive to abate more carbon. The key determinant of how much physical abatement takes place is, therefore, dependent upon two main factors: the physical cost of abatement and the price of a carbon allowance (typically 1 tonne of carbon dioxide).
Successes with Emissions Trading
One of the earliest success stories for cap and trade was the system implemented in the USA in 1990 to curb sulphur dioxide (SO2) emissions that were causing acid rain. The Clean Air Act amendments of 1990 aimed to slash annual SO2 emissions by 10 million tonnes, out of the total 26 million tonnes being emitting mainly by 3,200 coal plants. The government freely allocated emission allowances and then let the companies decide how to trade them in order to meet the requirements under the new, much lower cap on total emissions. Between 1990 and 2004, SO2 emissions from the power sector fell 36%, even though total energy output from coal-fired power plants increased by 25% over the same period. By 2010, total emissions had fallen to only 5.1 million tonnes, a reduction of 81%. The program was so successful that Harvard University produced a full report highlighting the successes and what was learned. See the full report here.
In Europe, the EU ETS is also considered to be a success. Since its implementation in 2005, annual emissions have declined by 29% in 2018 while real GDP grew by 8% over the same period. The EU has one of the lowest per capita emissions in the world and the emissions per unit of GDP continue to fall.
Contact us with us for further information on emissions trading and climate change.